BIO ML
Auditing Structural-Signal Interpretation in OpenBind Prediction Scores
Ilho Ahn
A reproducible benchmark audit comparing OpenBind prediction-score correlations with property baselines and ligand-only controls to examine the limits of structural-signal interpretation.
OpenBind’s first public release provides compound-level affinity measurements together with prediction scores from several structure-based methods. The official analysis also reported molecular weight as a strong affinity-ranking baseline for this release [1].
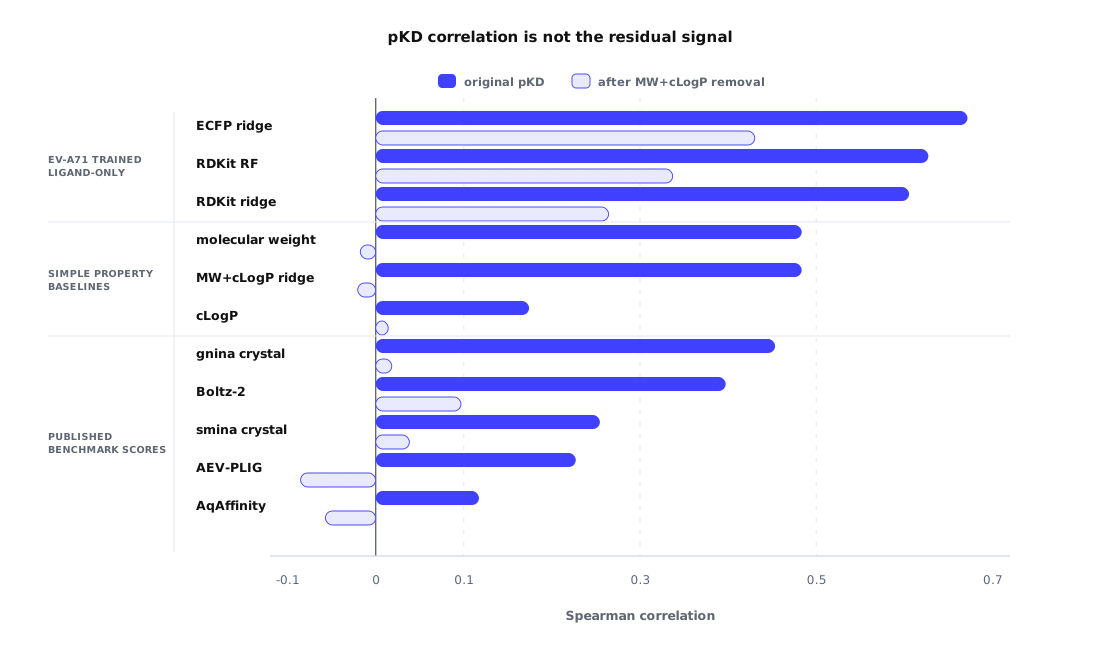
This note independently reconstructs the public compound table and tests whether the prediction scores retain correlation with pKD after adjustment for MW and cLogP. The public score with the highest correlation with adjusted pKD was Boltz-2 at 0.097; a ligand-only ECFP control trained on labels from the same campaign reached 0.430.
These values are not a model ranking obtained under identical training conditions. The comparison neither directly decomposes structural contribution nor evaluates generalization to new chemical series. Its scope is a retrospective audit that should precede interpretation of public score–pKD correlation as structure-based affinity signal.
Summary
- OpenBind had already shown that molecular weight is a strong affinity-ranking baseline in this release. This audit confirms that observation at compound level and adds MW+cLogP adjustment and ligand-only controls.
- The analysis covers
494compounds aligned to the public benchmark and7score files:5from trained or scoring methods and2property baselines, molecular weight and cLogP. - MW+cLogP-adjusted pKD is a diagnostic value computed over the full compound table. The public method score with the highest correlation with this value was Boltz-2 at
0.097. - ECFP ridge at
0.430is a shuffled 5-fold out-of-fold ligand-only control trained on raw pKD from the same campaign. It is neither a model ranking under the public scores’ training conditions nor a generalization result for new chemical series. - The mean ordering of public scores and ligand-only controls was preserved under compound and chemical-group resampling. Because the models were not retrained group-held-out, this is not evidence of strict scaffold generalization.
- In a separate follow-up, adding distance, contact, and atom-count descriptors from prepared structures to ECFP did not increase correlation. This is a secondary result for a limited structure-descriptor design, not a reproduction of the primary comparison.
Public resources
Evaluation Setup
EV-A71 2A protease is the protein-cleaving enzyme of Enterovirus A71. The experimental structures and affinities in OpenBind’s first release were generated with a CVA16 2A surrogate whose sequence differs from EV-A71 2A at only five positions, none close to the active site [1].
pKD expresses the dissociation constant on a logarithmic scale; higher values indicate stronger binding. Spearman correlation measures similarity in rank rather than absolute magnitude.
MW and cLogP are molecular weight and calculated lipophilicity, respectively. Here, MW+cLogP-adjusted pKD is a diagnostic value with the trend explained by these two properties removed; it is not ground truth for signal originating from structural information. A ligand-only control uses only ECFP/RDKit compound representations, without protein structure.
The comparison unit is the compound. The raw OpenBind affinity data can contain multiple measurement rows for one compound, and an inclusion flag in the public data identifies the rows used in the final benchmark [2]. The OpenBind repository publishes the affinity measurements, compound information, method-specific prediction scores, and the rules used to assemble the score comparison table [3].
This note does not reinterpret raw measurements or recombine multiple measurement rows into a new compound-level pKD. Instead, it aligns to the compound-level table already prepared for the public benchmark and compares each public prediction score with the corresponding compound-level pKD.
The comparison has two steps. First, it measures how closely each prediction score follows the measured pKD ranking. It then tests whether that correlation remains after removing the component of pKD explained by molecular weight and cLogP. This is not a final evaluation of structure-based methods. It is a basic check on whether correlation with pKD can be interpreted as structure-based affinity signal.
The evaluation contract is:
- Public benchmark scores are the compound-level scores provided by OpenBind, used without retraining or calibration.
- MW+cLogP-adjusted pKD is the value remaining after linearly regressing pKD on molecular weight and cLogP across all
494compounds. It is a descriptive adjustment over the full table, not a held-out target. - Ligand-only controls are out-of-fold predictions generated by shuffled 5-fold cross-validation over the same
494compounds. ECFP ridge is trained on raw pKD, and folds are split by compound rather than scaffold or similarity cluster. - Uncertainty ranges are calculated by resampling compounds or chemical groups while holding the already computed scores and out-of-fold predictions fixed. They do not include variation from retraining or performance on new chemical series.
Table 1 summarizes how the raw data are organized into the final comparison unit.
| Group | Item | Value |
|---|---|---|
| Public raw data | Affinity measurement rows | 2733 |
| Measurement rows used in benchmark | 1613 |
|
| Rows linked to structures | 925 |
|
| Public scores | Score rows by compound–method pair | 3458 |
| Final comparison unit | Compounds compared in this note | 494 |
| Compounds processable by RDKit | 494 |
|
| Public score files 5 methods + 2 property baselines |
7 |
494 compounds with pKD aligned at the same compound level. The 7 public score files comprise 5 trained or scoring methods and 2 property baselines.Results
Confirmation of the public property-baseline observation
The OpenBind release article had already identified molecular weight as a strong affinity-ranking baseline for this release [1]. In this audit, the Spearman correlation between molecular weight and measured pKD was 0.484, and an MW+cLogP linear model explained about 30% of the pKD variation in the full compound table (R² = 0.299).
This result is not presented as a new ligand-property effect. It establishes the starting condition for separating public prediction-score correlation from the MW+cLogP trend.
Figure 2 shows the relationship between molecular weight and pKD.
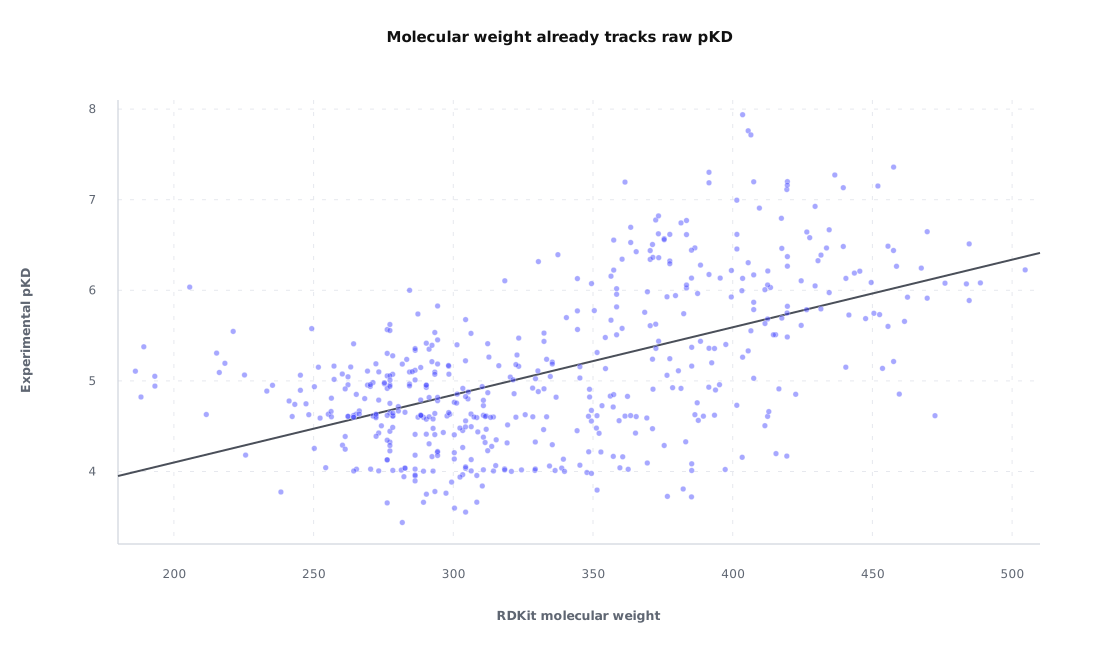
0.484; the line is a descriptive linear trend. This relationship serves as a simple ligand-property baseline that should be checked before interpreting correlation with measured pKD.Subsequent comparisons use the value remaining after pKD was linearly regressed on molecular weight and cLogP across all 494 compounds. This value does not represent every signal that should be removed in a real medicinal-chemistry process. Changes in compound size or lipophilicity can themselves move with potency. The resulting value is therefore not ground truth for “true affinity signal,” but a descriptive adjustment over the full table used to examine how strongly prediction-score correlation with pKD depends on a large property trend.
Table 2 reports the ligand-property baselines checked before MW+cLogP adjustment.
| Comparison | Metric | Value |
|---|---|---|
| molecular weight | Spearman with measured pKD | 0.484 |
| MW+cLogP linear model | Descriptive R² |
0.299 |
Correlation with MW+cLogP-adjusted pKD
First, pKD was linearly regressed on molecular weight and cLogP across all 494 compounds, and the remaining values were calculated. The analysis then measured how closely the ranking of this adjusted pKD matched each method-score ranking.
The highest public-score correlation with adjusted pKD was Boltz-2 at Spearman 0.097. ECFP ridge reached 0.430 using ligand information and labels from the same campaign. The two values answer different questions: how a supplied score relates to this target, and how much a campaign-supervised ligand representation can predict. Neither value isolates a structural contribution.
The public OpenBind benchmark scores and the ECFP ridge control do not have the same role. The public benchmark scores are externally supplied fixed scores. ECFP ridge is a supervised ligand-only out-of-fold prediction generated by shuffled 5-fold cross-validation using raw pKD from the same EV-A71 2A campaign. The Morgan fingerprint used radius 2 and 2048 bits; Ridge alpha was 10, and the split seed was 20260508.
The difference between 0.097 and 0.430 is therefore not a model ranking under an identical training and evaluation contract. It is a diagnostic comparison showing that ligand representations alone, trained within the same campaign, can produce a higher correlation with MW+cLogP-adjusted pKD. Under this condition, it is difficult to identify an independent contribution from structural information from the public scores’ raw-pKD correlation alone.
Table 3 retains this role distinction while compactly reporting Spearman correlation with MW+cLogP-adjusted pKD.
| Score source | Highest method | Structural information | MW+cLogP-adjusted pKD Spearman |
|---|---|---|---|
| Public benchmark score | Boltz-2 | Uses structure/pose | 0.097 |
| Ligand-only Same EV-A71 2A data |
ECFP ridge | Not used | 0.430 |
-0.334 before rounding. This difference is not a performance difference between models trained under identical conditions; it is a diagnostic gap between public fixed scores and a campaign-supervised ligand control.Figure 1 places each score’s Spearman correlation with measured pKD and MW+cLogP-adjusted pKD side by side. Correlations for the public scores generally weakened after adjustment, while controls built from ligand representations within the same campaign showed higher correlations.
Resampling sensitivity
To assess sensitivity to compound composition, compound rows were resampled with replacement 1000 times while holding the already computed scores and out-of-fold predictions fixed. These ranges reflect correlation variation from resampling the current 494 compounds, not variation from retraining the models. Mean Spearman correlations with MW+cLogP-adjusted pKD were 0.096 for Boltz-2 and 0.429 for the ECFP ridge control; their respective 95% ranges were [0.008, 0.179] and [0.354, 0.497].
Table 4 reports method-level uncertainty ranges for Spearman correlation with MW+cLogP-adjusted pKD.
| Method | Structural information | MW+cLogP-adjusted pKD Mean Spearman |
95% range |
|---|---|---|---|
| ECFP ridge | Not used | 0.429 | [0.354, 0.497] |
| RDKit descriptor RF | Not used | 0.337 | [0.258, 0.413] |
| RDKit descriptor ridge | Not used | 0.263 | [0.175, 0.345] |
| Boltz-2 | Uses structure/pose | 0.096 | [0.008, 0.179] |
| Gnina crystal | Uses structure/pose | 0.015 | [-0.073, 0.104] |
1000 times while holding the already computed scores and out-of-fold predictions fixed. The highest public benchmark correlation remained weakly positive, but did not reach the range of the ligand-only control in this comparison.The grouped bootstrap used Murcko scaffolds or Butina clusters as the resampling unit to test whether changes in the weight of particular chemical groups reversed the direction of the correlations. At each iteration, groups were sampled with replacement and Spearman correlation was recalculated over the compound rows belonging to those groups. ECFP ridge was not retrained with group-held-out folds, so this procedure does not remove the possibility that similar compounds occur in both training and evaluation folds.
Across 300 Murcko-scaffold resamples, the highest mean among public benchmark scores was 0.098 for Boltz-2, and the highest mean among ligand-only controls was 0.421 for ECFP ridge, a difference of -0.323. Figure 3 shows a separate Butina Tanimoto 0.6 resampling result: 0.075 for Boltz-2 and 0.395 for ECFP ridge, a difference of -0.320. The comparison direction was preserved under both groupings, but this measures group-weighting sensitivity of the current scores rather than chemical-series generalization.
A Murcko scaffold groups similar compounds by their central molecular framework.
Butina Tanimoto 0.6 clusters compounds with high fingerprint similarity. Here it is used as a secondary check on whether similar compounds easily reverse the conclusion.
Figure 3 presents the Butina resampling result, while Table 5 reports the group composition, including the high singleton rate, and the resulting interpretive limit.
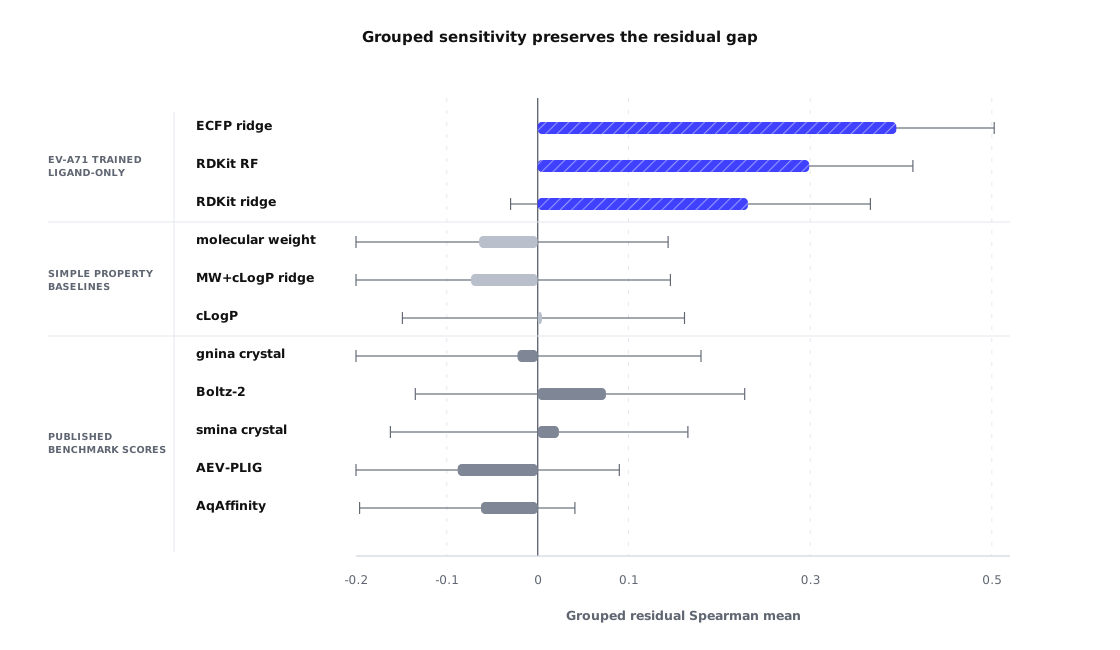
300 grouped-bootstrap iterations; lines show 95% ranges. Because the models were not retrained cluster-held-out, this measures sensitivity to cluster composition rather than chemical-series generalization.| Grouping rule | Groups | Singleton groups |
|---|---|---|
| Murcko scaffold | 275 |
82.2% |
| Butina Tanimoto 0.6 | 175 |
71.4% |
Prepared-structure descriptor follow-up
A separate matched-pipeline comparison trained directly on adjusted pKD. Adding coarse distance, contact, and atom-count descriptors to ECFP changed Spearman from 0.360 to 0.279 (-0.081). This concerns that descriptor set, rather than all possible structural representations. Appendix Table 3 gives the complete follow-up and explains why its baseline differs from the primary ECFP value of 0.430.
Interpretation
The audit’s main result is the contrast between raw and adjusted correlations within each public score. Their association with measured pKD weakens after removing the full-table MW+cLogP trend. This makes raw score–pKD correlation alone insufficient to identify an independent structural contribution; it does not establish that structural information was unused or unhelpful.
The ligand-only controls show that campaign labels and compound representations carry additional predictive information under random-fold evaluation. Their stronger adjusted correlation motivates using such controls when interpreting a structural method, while their different training conditions prevent a direct superiority claim. Group resampling tests the sensitivity of these recorded scores to chemical composition. Generalization to unseen series would require a separate group-held-out or prospective comparison.
Limitations
- These results are limited to one public EV-A71 2A release. This is not a prospective evaluation with new compounds separated in advance, and it does not assess the performance of OpenBind as a whole or of structure-based affinity prediction in general.
- MW+cLogP adjustment is a descriptive adjustment calculated across all
494compounds. Property trends can be entangled with real potency changes, so adjusted pKD is not interpreted as ground truth for signal originating from structural information. - The ECFP controls are random 5-fold out-of-fold models trained on raw pKD from the same campaign. They do not form a model ranking under conditions identical to the public fixed scores and do not measure generalization to new chemical series.
- The grouped bootstrap resamples chemical groups while holding existing scores and predictions fixed. Because it does not retrain group-held-out and has a high proportion of singleton groups, it neither removes analog leakage nor establishes scaffold generalization.
- Sensitivity to the rule used to consolidate measurement rows into compound-level pKD and to measurement uncertainty was not evaluated. The structure follow-up is also limited to
312distance, contact, and atom-count descriptors aggregated from prepared poses, so it does not rule out the value of more detailed structural representations.
Appendix: Evaluation and Reproduction Contract
| Stage | Fixed contract | Interpretive boundary |
|---|---|---|
| Input snapshot | 86e5c12 revision of the OpenBind affinity repository and Zenodo v1 |
Rechecked on 2026-07-30 that the SHA-256 hashes of the 11 affinity inputs in the experiment provenance match the files at this revision |
| MW+cLogP adjustment | One OLS fit across all 494 compounds |
Descriptive adjustment calculated over the full table; not a cross-fitted target |
| Ligand-only control | Shuffled 5-fold CV, seed 20260508; ECFP radius 2, 2048 bits; Ridge alpha 10 |
Compound-random OOF prediction; not a scaffold-disjoint evaluation |
| Compound bootstrap | Sample rows of fixed scores/predictions with replacement 1000 times |
Percentile 95% range; models and the MW+cLogP adjustment model are not refit |
| Grouped bootstrap | Sample Murcko or Butina Tanimoto 0.6 groups with replacement 300 times |
Group-weighting sensitivity, not group-held-out retraining |
| Prepared-structure descriptor | Parse 925 Zenodo v1 structures; aggregate 649 reference-linked instances into 494 compounds and 312 features |
Separate 5-fold pipeline trained directly on adjusted pKD; not compared directly with the primary ECFP result of 0.430 |
3.12.3, NumPy 2.2.6, pandas 2.3.3, SciPy 1.17.1, scikit-learn 1.7.1, and RDKit 2026.03.1.The main text retains only the values needed for interpretation. Appendix Table 2 is a supporting view of measured-pKD and MW+cLogP-adjusted-pKD Spearman correlations across all methods. It is intended to inspect the difference between the two correlations, not to establish a definitive method ranking.
| Method | Measured pKD Spearman |
MW+cLogP-adjusted pKD Spearman |
|---|---|---|
| ECFP ridge | 0.672 | 0.430 |
| RDKit descriptor RF | 0.627 | 0.337 |
| RDKit descriptor ridge | 0.605 | 0.264 |
| Boltz-2 | 0.397 | 0.097 |
| Smina crystal | 0.255 | 0.038 |
| Gnina crystal | 0.453 | 0.018 |
| cLogP | 0.174 | 0.014 |
| molecular weight | 0.484 | -0.017 |
| MW+cLogP ridge | 0.484 | -0.020 |
| AqAffinity | 0.117 | -0.057 |
| AEV-PLIG | 0.227 | -0.085 |
Prepared-structure follow-up details
A prepared-structure descriptor is a feature derived from public structures by calculating protein and ligand atom counts, minimum distances, contact counts at several distance thresholds, element pairs, and pocket-residue information, then aggregating means and maxima by compound. It is not a detailed interaction model; it coarsely summarizes size, distance, and contact counts around a prepared pose.
Separately from the public-score analysis, a limited follow-up tested whether simple prepared-structure descriptors added signal to the ligand representation. From the Zenodo v1 prepared-structure archive [4], 312 descriptors were created from atom counts, minimum distances, protein–ligand contacts at distance thresholds of 3.5, 4.5, 6.0, and 8.0 Å, element pairs, and pocket-residue information.
All 925 structure files were parsed. Of these, 649 structure instances linked to public compound references were aggregated over 494 compounds and used as follow-up model inputs.
The ECFP baseline in this follow-up uses a different evaluation pipeline from the earlier ECFP ridge result of 0.430. In the primary comparison, 0.430 is the correlation between a 5-fold out-of-fold score trained with ECFP to predict raw pKD and adjusted pKD computed over the full table. Here, 0.360 comes from sparse-scaling ECFP and retraining it under the same shuffled 5-fold cross-validation to predict adjusted pKD directly. It is therefore invalid to interpret the change from 0.430 to 0.360 as a performance decrease. The 0.360 value is an internal follow-up baseline for assessing the addition of prepared-structure descriptors.
Within this same follow-up pipeline, the model using prepared-structure descriptors alone reached Spearman 0.156, the model adding the descriptors to ECFP reached 0.279, and the ECFP-only baseline reached 0.360. The difference after adding the descriptors was therefore -0.081.
Appendix Table 3 summarizes Spearman correlation with MW+cLogP-adjusted pKD after adding prepared-structure descriptors.
| Input information | MW+cLogP-adjusted pKD Spearman |
|---|---|
| ECFP only | 0.360 |
| Prepared-structure descriptors | 0.156 |
| ECFP + structure descriptors | 0.279 |
| RDKit descriptors + ECFP | 0.369 |
| RDKit descriptors + ECFP + structure descriptors | 0.283 |
312 distance, contact, and atom-count descriptors from prepared structures to ECFP produced a difference of -0.081; the 95% range from 1000 paired row-bootstrap iterations over fixed out-of-fold predictions was [-0.146, -0.012].This result is limited to this coarse descriptor set and follow-up pipeline. It does not test whether the public methods use structural information, and it does not rule out gains from richer structural representations.
Experiment Resources
The core analysis can be rerun from the OpenBind Affinity Score Audit reproduction repository [5]. The repository downloads input CSVs from the pinned OpenBind revision, verifies SHA-256 hashes, and reproduces compound-table reconstruction, MW+cLogP adjustment, ligand-only controls, and Murcko and Butina grouped sensitivity with one command. The prepared-structure descriptor follow-up is outside the public scope of the core audit.
Reproduction repository
References
- OpenBind Consortium. OpenBind's first release: A structure-affinity dataset for structure-based AI. OpenBind, May 5, 2026. OpenBind blog
- OpenBind Consortium. Affinity and Kinetics Data in the EV-A71 2A OpenBind Release. OpenBind, May 5, 2026. OpenBind blog
- OpenBind Consortium. EV-A71_2A_benchmark affinity files. GitHub, revision
86e5c12, 2026. Pinned repository directory. Repository code: Apache-2.0; released data: CC0 1.0. - OpenBind Consortium. OpenBind Structure-Affinity Data Release: Enterovirus A71 (EV-A71) / Coxsackievirus A16 (CVA16) 2A protease. Zenodo, version v1, May 5, 2026. DOI: 10.5281/zenodo.20026661. Data license: CC0 1.0.
- Soleaf. OpenBind Affinity Score Audit. GitHub, version
0.1.0, 2026. Reproduction repository. License: Apache-2.0.
Citation
Text citation:
Ilho Ahn, "Auditing Structural-Signal Interpretation in OpenBind Prediction Scores", Mini Research, May 10, 2026.
BibTeX:
@misc{ahn2026openbind_affinity_baseline_check,
  author = {Ahn, Ilho},
  title = {Auditing Structural-Signal Interpretation in {OpenBind} Prediction Scores},
  year = {2026},
  month = {May},
  howpublished = {Mini Research},
  url = {https://muted-color.github.io/research/2026/05/10/openbind-affinity-baseline-audit/}
}