LLM ALIGNMENT
Alignment Data Map: From Measurements to Preference-Pair Supervision
Ilho Ahn
This note traces how Alignment Data Map coordinates vary with the reference answer and text processing, and how selected instructions become preference pairs used for training.

Lee et al.’s Alignment Data Map (ADM) [1] selects preference data by grouping instructions according to the mean and variance of alignment scores computed over their candidate responses. Whether these coordinates remain stable across reference answers and text-processing methods, and how instruction selection translates into the composition of the actual training pairs, require separate validation. This note traces 4,500 instructions from changes in coordinates and regions under different measurement conditions to the conversion of selected instructions into preference pairs used for training.
ADM regions changed with the reference answer, long-text processing method, and cohort composition. Even with the same instruction quotas, expanding the selected instructions into response pairs produced different preference directions, score gaps, and repeated-exposure structures.
In this note, quality is the mean sentence-embedding similarity between candidate responses and the reference answer. It does not denote overall response quality or agreement with human preferences.
Summary
- The analysis traced how ADM measurements for 4,500 instructions, each with 4 candidate responses, became actual preference pairs used for training.
- Changing the reference-answer generation policy or long-text processing method changed the ADM region assigned to the same instruction.
- Matching instruction composition did not equalize the score gaps, preference directions, or repeated exposures of the instantiated response pairs.
- The single-seed training comparison showed differences across region pipelines, but did not isolate an effect of the ADM region itself.
Problem Setting
ADM forms HighAvg, LowAvg, and HighVar regions from the mean and variation of candidate-level alignment scores. The use of mean and variation to characterize data follows Swayamdipta et al.’s Dataset Cartography [2], while ADM applies this view to preference-data selection.
The original ADM study reported that the aggregate training-performance advantage of HighAvg selection persisted across maps built with LLM-as-a-judge, reward-model, and reference-based scoring [1]. Rather than re-evaluating aggregate performance, this analysis examines whether the coordinates and region of the same instruction remain stable across measurement conditions, and how instruction-level selection is transformed into actual training pairs. Stability of aggregate performance and stability of individual-sample region assignments are distinct questions.
Song’s data-centric alignment pipeline [3] separates alignment data construction into response synthesis, preference evaluation, and preference instantiation. The contribution here is not this pipeline view itself, but a quantitative case study of the transformation from ADM’s reference-based measurement to actual SimPO preference pairs.
Preference-pair score gaps and composition have been studied by Yang et al. [4], Deng et al. [5], and Xiao et al. [6], while Pan et al. analyzed the quality of chosen responses [7]. This note does not evaluate the general superiority of a particular selection rule; it analyzes the response-pair-level training signal formed after instruction-level selection.
Experimental Setup
Reference-Based Measurement and Region Construction
The measurement cohort contained 4,500 UltraFeedback instructions [8], sampled with consideration of source dataset, task type, and instruction length, with 4 candidate responses per instruction. Reference answers were generated using Qwen3.5-122B-A10B in non-thinking mode with temperature 0 and a maximum of 4,096 tokens.
For each candidate response, cosine similarity to the reference answer was computed with the Sentence-BERT-family all-mpnet-base-v2 model [9] [10]. The prefix baseline used at most 384 tokens. For each instruction, the mean of the four similarities was defined as quality and their population variance as variability. Based on ranks within the full cohort, LowAvg, HighAvg, and HighVar were each assigned 1,500 instructions. A region therefore denotes a relative position within a particular reference-answer, scoring-method, and cohort configuration, not an absolute grade.
The analysis of actual training pairs used a map recomputed with overlapping-window means and stratified by source and task type. This condition is not the same as the initial map partitioned directly over the full cohort.
Preference Pairs and Training Comparison
ADM selects instructions, whereas Meng et al.’s SimPO [11] trains on chosen–rejected response pairs. This analysis constructed all pairs of candidate responses whose source ratings differed and matched instruction quotas across the three regions within each source-by-task-type stratum. The realized training split contained 1,080 instructions per region, or 3,240 in total, which expanded into 17,301 pairs.
Qwen2.5-3B-Instruct was trained for up to 5 epochs with LoRA and SimPO. The learning rate was 5e-6 and the global batch size was 63. Within each region-specific development set, models were selected by the number of pairs matching the preferred direction, then by loss, then by earlier checkpoint. They were then compared on the same 600-pair development set with no prompt or pair overlap with the training data. The analysis separately tracked the instructions selected by ADM and the response pairs used by SimPO.
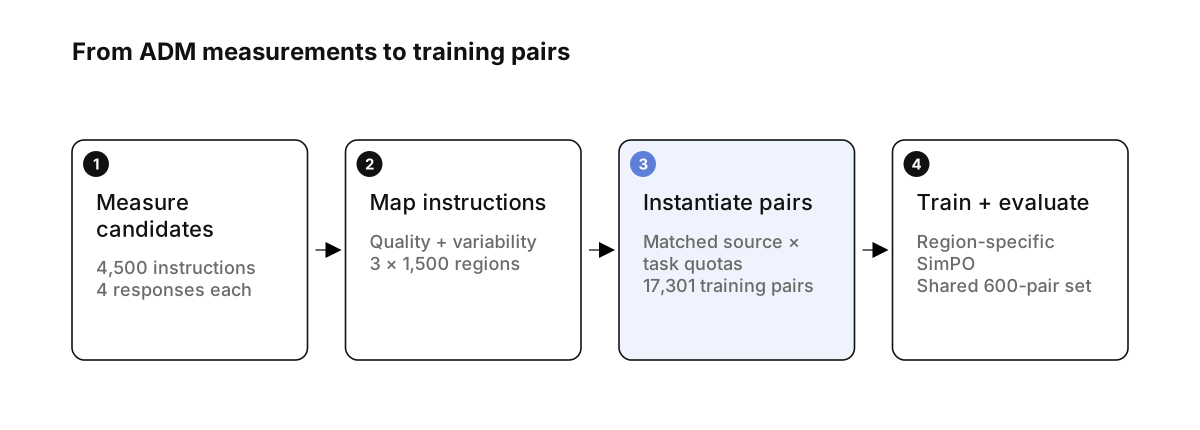
Figure 1 summarizes the full path from reference-conditioned candidate measurement to region-specific SimPO evaluation.
Results
Sensitivity to Reference Answers and Long-Text Processing
When GPT-4o and Qwen3.5 reference-answer generation policies were applied to the same 100 instructions and identical candidate responses, candidate-order agreement was .760, with a 95% bootstrap CI of .710–.808. The rank correlation for variance was .854, region macro-F1 was .7395, and 64 of 100 instructions had at least one reversal in candidate order.
In a separate comparison on a shared set of 60 samples, pairwise candidate-order agreement across GPT-4o, Qwen3.5, and three gpt-oss-120B repeats ranged from .7722 to .8472, and region macro-F1 ranged from .6500 to .8000.
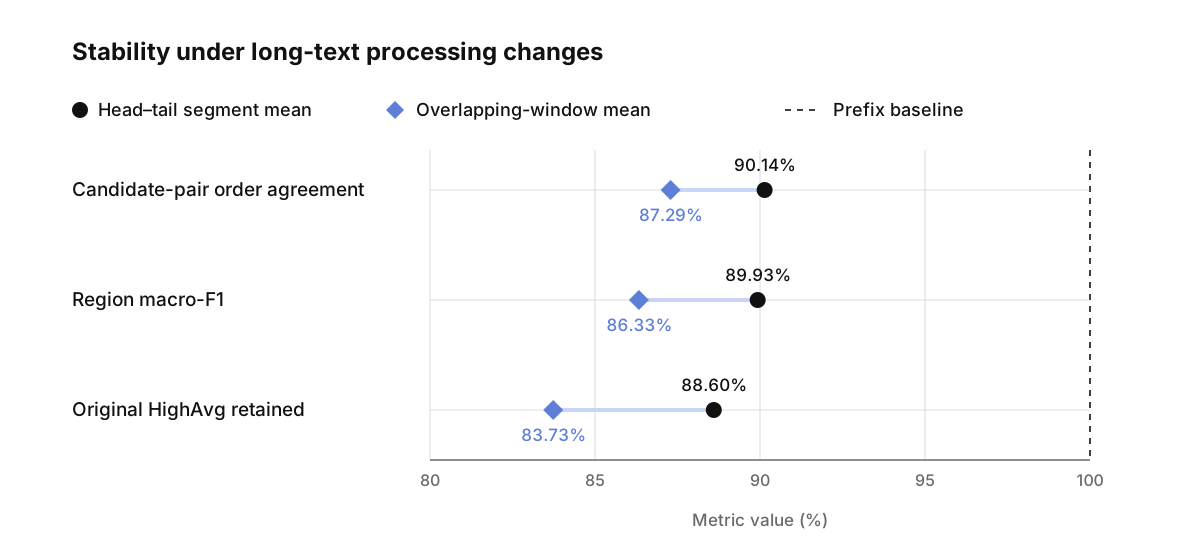
Region shifts remained even when candidate responses and reference answers were fixed and only the long-text processing method changed. In Figure 2, higher values on all three metrics indicate greater agreement with the prefix baseline. Overlapping-window mean was farther from the baseline than head–tail segment mean on every metric.
Cohort Composition and Region Association
Figure 3 shows the ADM coordinates and relative-rank boundaries for all 4,500 instructions. Each region contains 1,500 instructions, but their data-source, instruction-length, and task-type compositions were not the same.
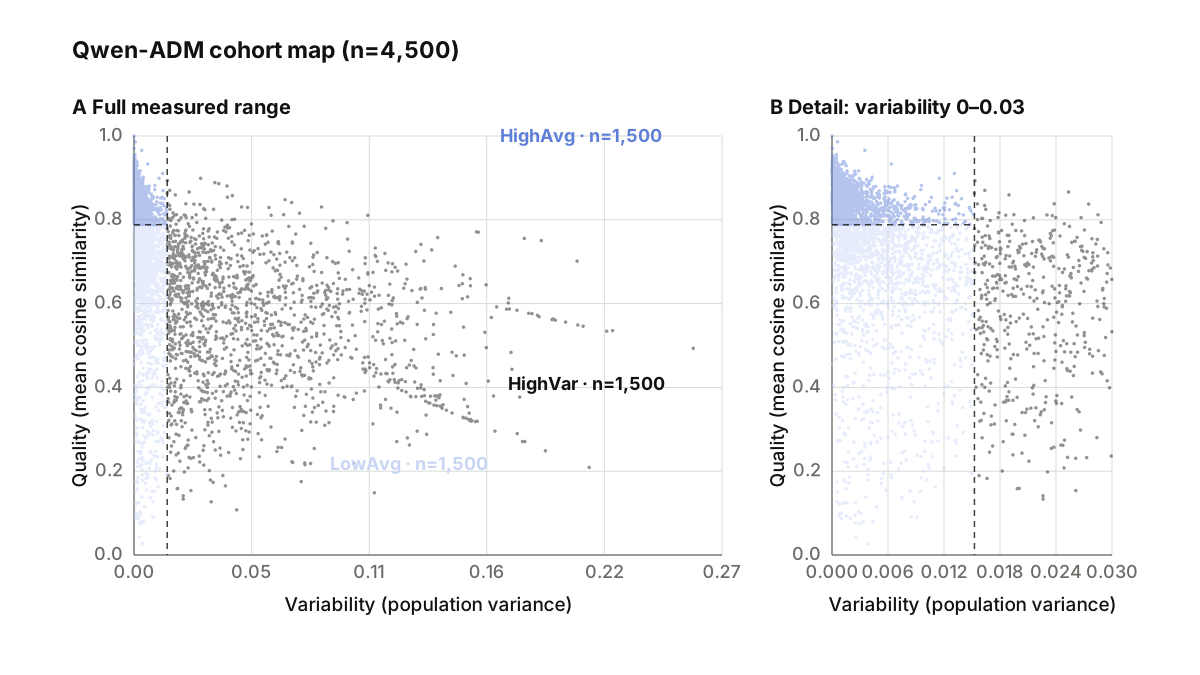
Cramér’s V between data source and ADM region assignment was .388. By region, 69.7% of HighAvg samples came from Evol-Instruct, while 58.4% of HighVar samples came from FLAN/NIV2. Cramér’s V between instruction-length quartile and region assignment was .192, and mean instruction length was 487 characters for HighAvg and 888 characters for HighVar. Cramér’s V between task type and region assignment was .160; 44.83% of Code instructions and 23.54% of Multi-constraint instructions were assigned to HighAvg.
On the overlapping-window-mean map, the source-distribution TV between the HighAvg training and development sets was .289 when matching considered task type only. After reconstruction by source and task type, it decreased to .030. This decrease follows directly from matching source composition, but the reconstruction also changed the regions of 1,387 of 4,500 instructions and changed the selected instructions and response pairs. Later training differences therefore combine multiple changes in data construction.
Instruction Selection and Instantiated Preference Pairs
In a separate HighAvg data construction, the overall-quality rating direction and alignment-score direction disagreed on 862 of 3,229 non-tied pairs, or 26.7%. ADM instruction selection and response-pair preference labeling are not the same stage.
The instantiated training-pair composition also differed across the three regions after matching instruction quotas within each source-by-task-type stratum. In Table 1, the differences in source rating and alignment score are absolute values. A lower opposite-direction rate means the two criteria agree more often.
| Region | Training pairs | Source-rating gap median |
Alignment-score gap median |
Alignment-score gap <.05 |
Opposite direction | Mean pairs per instruction |
|---|---|---|---|---|---|---|
| LowAvg | 5,774 | 1.000 | .0727 | 36.91% | 37.51% | 5.346 |
| HighAvg | 5,682 | .750 | .0490 | 50.70% | 32.95% | 5.261 |
| HighVar | 5,845 | 1.250 | .2047 | 17.74% | 26.48% | 5.412 |
Source-by-task-type TV was 0 at the instruction level, but after expansion into response pairs, source-by-task-type TV remained .0101–.0127 and length-bin TV remained .0418–.0728. Matching instruction composition alone did not equalize response-pair direction, score gap, or repeated exposure.
Single-Seed Pipeline Comparison
Reward accuracy is the proportion of pairs for which the model assigns a higher reward to the chosen response than to the rejected response; higher is better. Reward margin is the mean difference between the two rewards; higher is better. SimPO loss is sensitive to failures to reach the target margin and to the negative-margin tail; lower is better.
Table 2 compares three region pipelines, each including region-specific model selection, with the base model on the same shared 600-pair development set.
| Pipeline | Preferred-direction matches | Reward accuracy | Reward accuracy Δ vs. base model |
SimPO loss | Reward margin |
|---|---|---|---|---|---|
| Qwen base | 378/600 | 63.00% | — | 1.253075 | 1.395679 |
| LowAvg | 421/600 | 70.17% | +7.17pp | 1.031459 | 1.506562 |
| HighVar | 431/600 | 71.83% | +8.83pp | 1.031298 | 1.573699 |
| HighAvg | 442/600 | 73.67% | +10.67pp | 1.019236 | 2.149893 |
In this single-seed comparison, HighAvg had 11 more preferred-direction matches than HighVar and the best observed reward accuracy, reward margin, and SimPO loss.
Pipeline Interpretation
ADM coordinates are relative measurements that depend on the reference answer and text-processing method. The unit selected on the map is also different from the unit used in training: instructions versus response pairs. Even after matching instruction quotas, pair margins, directional disagreements, and repeated exposures per instruction differed.
Reproducing data selection and interpreting the scope of training results therefore requires recording not only the ADM region name, but also the reference-answer generation conditions, candidate-response set, text-processing method, cohort and region boundaries, response-pair construction rule, and the observed response-pair-level distributions.
Limitations and Follow-Up Comparisons
- The reference-answer comparison changed both the model and generation settings, and the 60-sample ranges summarize pairwise comparisons and repeated runs rather than confidence intervals. A complete measurement validation would apply multiple reference answers to the same 4,500 instructions and candidate responses, then compare long-text scoring methods against human judgments or task-answer-grounded annotations.
- The shared 600 pairs formed a repeatedly used development set, and pair-level confidence intervals were not computed. The pipeline comparison lacked random-selection and full-data conditions, and every training result came from a single seed. Region-specific model selection and response-pair composition also varied, so the comparison does not isolate an ADM-region effect. A multi-seed comparison should change only response-pair direction while holding data composition, model, and training settings fixed.
- Generalization to external data and downstream benchmarks was outside the evaluation scope.
Appendix: Main Metrics
- Mean similarity to the reference answer: Mean MPNet cosine similarity between the four candidate responses and the reference answer.
- Variability: Population variance of the four similarity scores (
ddof=0). - Candidate-response order agreement: Proportion of the six pairs formed by four candidates whose ordering agrees under two reference answers.
- Region macro-F1: Equally weighted mean of per-class F1 scores between two ADM region assignments.
- Cramér’s V: Strength of association between region and source, task type, or length category.
- Source-distribution distance (TV): Difference between the source proportions of two sets, $\frac{1}{2}\sum_i\lvert p_{1,i}-p_{2,i}\rvert$.
- Reward accuracy, reward margin, and SimPO loss: Respectively, the preferred-direction match rate, mean reward difference, and loss reflecting target-margin shortfalls and the negative-margin tail.
References
- Lee, S., Kim, E., Lee, H., and Chang, B. Alignment Data Map for Efficient Preference Data Selection and Diagnosis. Findings of ACL 2026, 38225–38241, 2026. ACL Anthology; arXiv
- Swayamdipta, S. et al. Dataset Cartography: Mapping and Diagnosing Datasets with Training Dynamics. EMNLP 2020, 9275–9293, 2020. ACL Anthology
- Song, H. Alignment Tuning for Large Language Models: A Data-Centric Lens on Alignment Data Pipelines. Findings of ACL 2026, 2541–2561, 2026. ACL Anthology
- Yang, S. et al. Not All Preference Pairs Are Created Equal: A Recipe for Annotation-Efficient Iterative Preference Learning. Findings of EMNLP 2024, 6549–6561, 2024. ACL Anthology
- Deng, X. et al. Less is More: Improving LLM Alignment via Preference Data Selection. arXiv:2502.14560, 2025. arXiv
- Xiao, Y. et al. Finding the Sweet Spot: Preference Data Construction for Scaling Preference Optimization. ACL 2025, 12538–12552, 2025. ACL Anthology
- Pan, Y. et al. What Matters in Data for DPO? NeurIPS 2025, 44689–44716, 2025. NeurIPS
- Cui, G. et al. UltraFeedback: Boosting Language Models with Scaled AI Feedback. ICML 2024, 9722–9744, 2024. PMLR; Dataset
- Reimers, N. and Gurevych, I. Sentence-BERT: Sentence Embeddings using Siamese BERT-Networks. EMNLP-IJCNLP 2019, 3982–3992, 2019. ACL Anthology
- Song, K., Tan, X., Qin, T., Lu, J., and Liu, T.-Y. MPNet: Masked and Permuted Pre-training for Language Understanding. NeurIPS 2020, 16857–16867, 2020. NeurIPS
- Meng, Y., Xia, M., and Chen, D. SimPO: Simple Preference Optimization with a Reference-Free Reward. NeurIPS 2024, 124198–124235, 2024. NeurIPS
Model and dataset resources: Qwen3.5-122B-A10B, Qwen2.5-3B-Instruct, all-mpnet-base-v2, and UltraFeedback.
Citation
Text citation:
Ilho Ahn, "Alignment Data Map: From Measurements to Preference-Pair Supervision", Mini Research, August 23, 2026.
BibTeX:
@article{ahn2026admmeasurementpreferencepairs,
  author = {Ilho Ahn},
  title = {Alignment Data Map: From Measurements to Preference-Pair Supervision},
  journal = {Mini Research},
  year = {2026},
  month = aug,
  url = {https://muted-color.github.io/research/2026/08/23/adm-measurement-to-preference-pairs/}
}